Class Index — Report
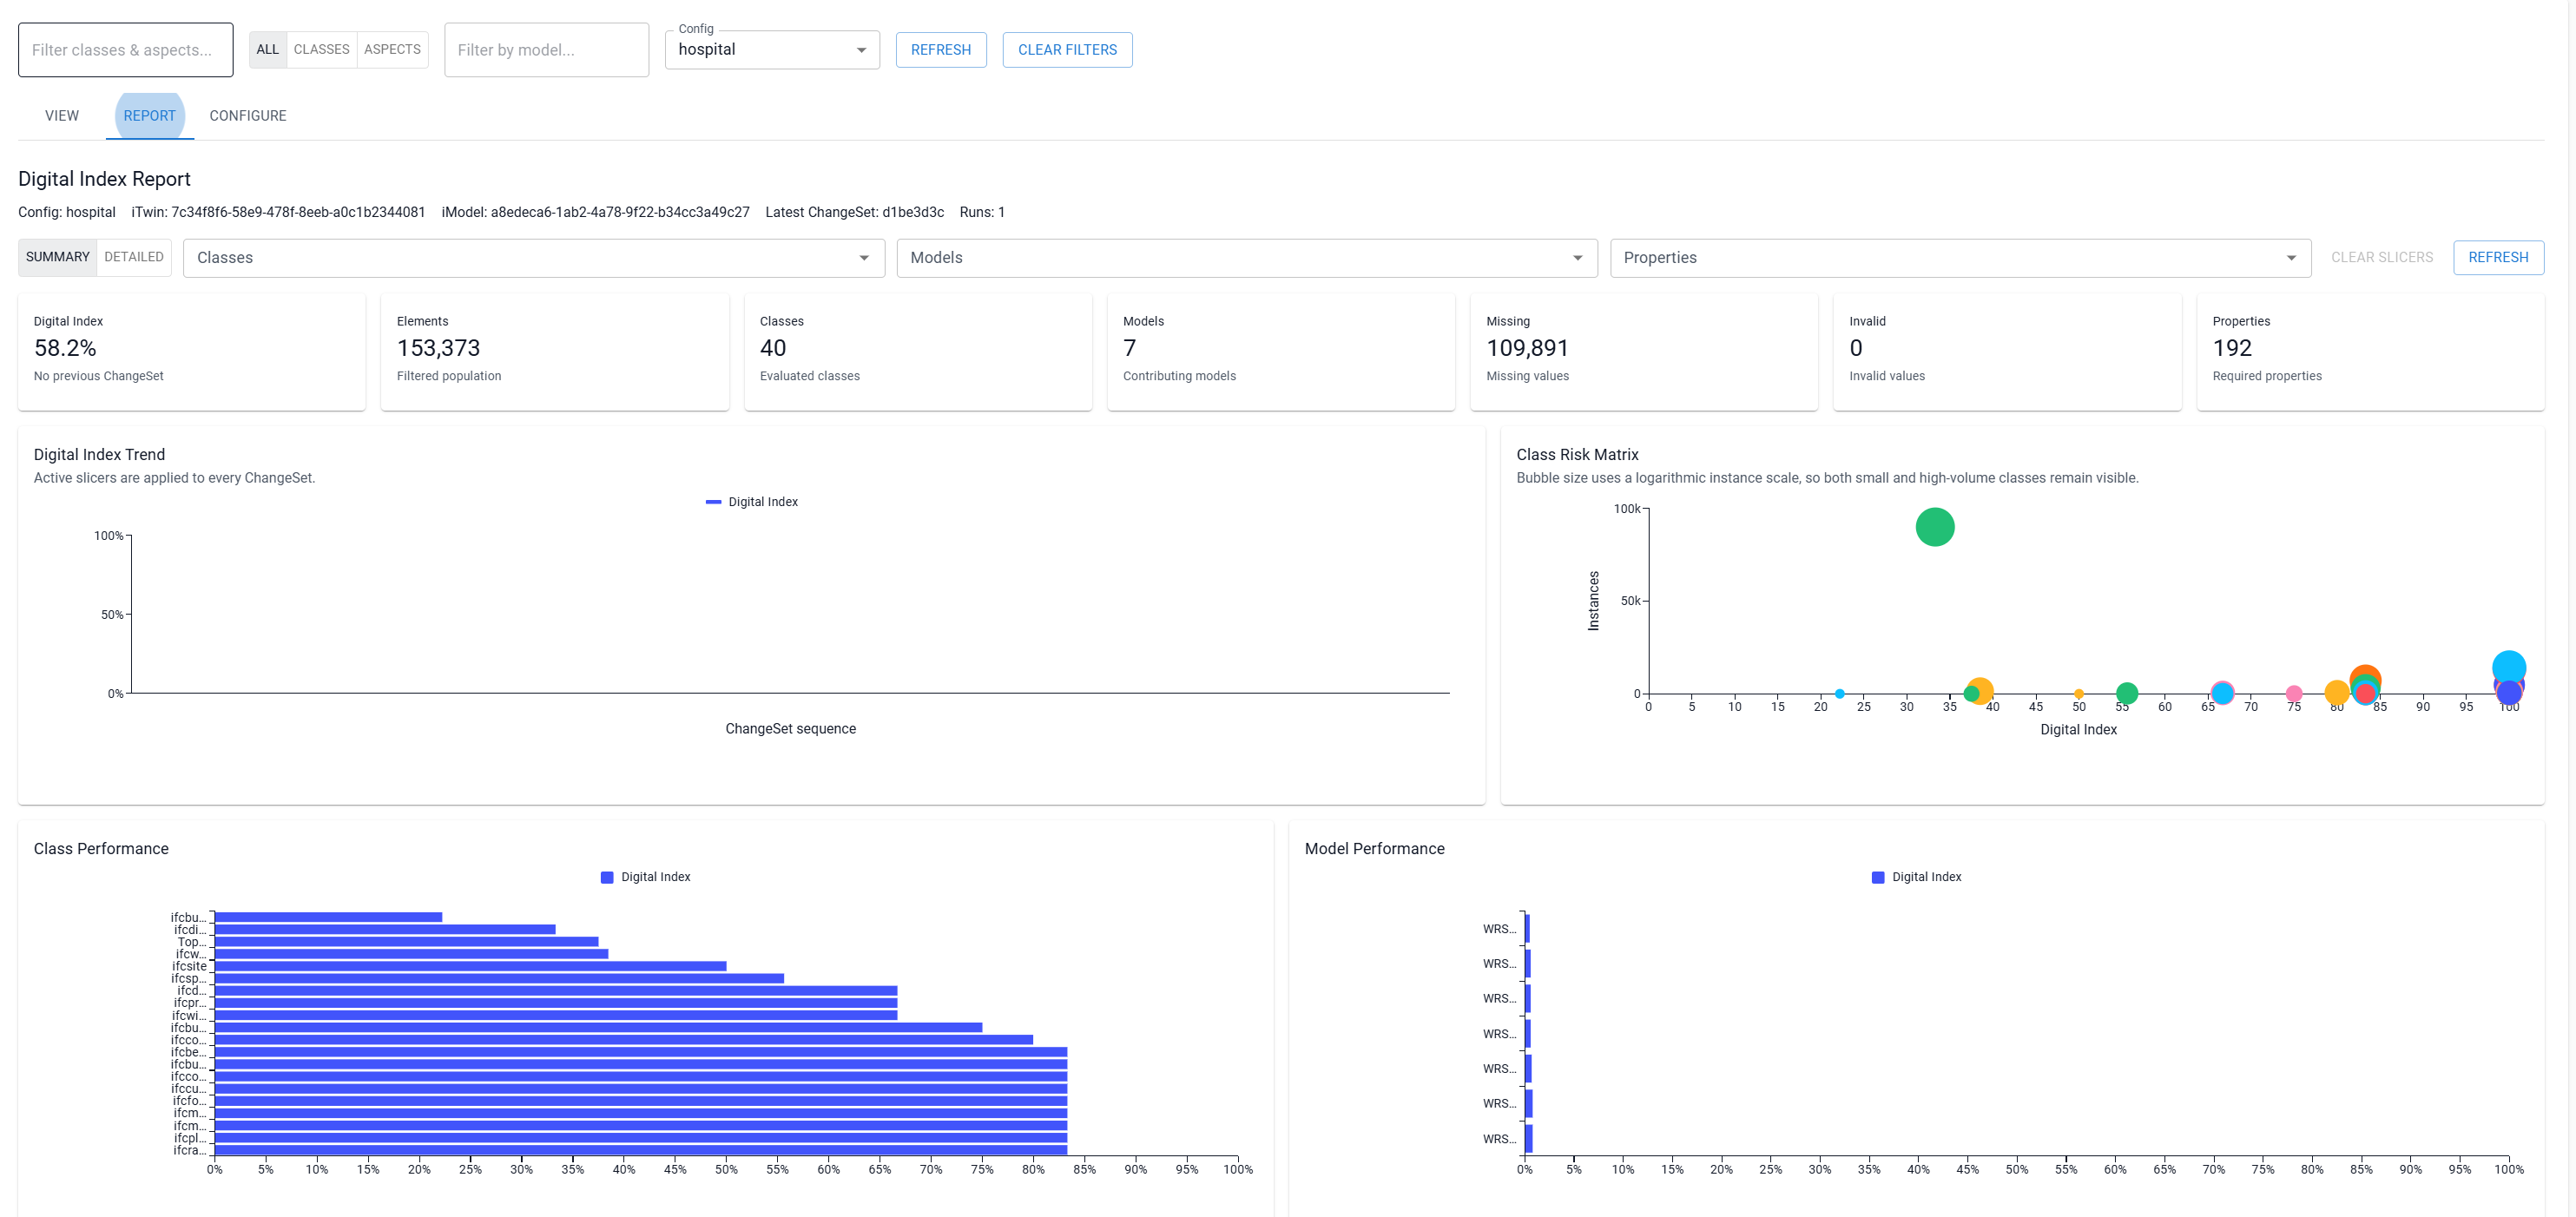
The Report tab is an analytical dashboard for published Class Index results. It enables BIM managers, information managers, and project teams to track data quality over time and answer five core questions in sequence:
- How good is the overall model data quality? (Headline Digital Index %)
- Is data quality improving across revisions? (Digital Index Trend across ChangeSets)
- Which classes or aspects pose the greatest risk? (Class Risk Matrix)
- Which discipline models contribute to the issues? (Model Performance & Class × Model Matrix)
- Which specific properties require remediation? (Property Completeness Table)
The reporting context is anchored to the selected configuration, iTwin, and iModel, displaying the latest ChangeSet and total published reporting runs in the header.
Data requirements
The Report dashboard visualizes published results. To generate reporting data:
- Open the View tab.
- Select Calculate to evaluate the current ChangeSet.
- Select Publish Results (requires Author entitlement) to commit the results to the reporting database.
[!NOTE] If no published results exist for the selected context, an informative banner is displayed prompting you to calculate and publish results.
Slicers and multi-dimensional filtering
The top of the dashboard provides three multi-select slicers:
| Slicer | Purpose |
|---|---|
| Classes | Filter by one or more 3D geometric classes or metadata aspects. |
| Models | Filter by one or more contributing design model files. |
| Properties | Filter by specific required properties evaluated in the configuration. |
How slicers combine
- Across different slicers: Selections combine with AND logic (for example, selecting class
Pipeand modelMEP_Building_Aisolates pipes in Building A). - Within the same slicer: Selections combine with OR logic (for example, selecting
WallandSlabincludes elements of either class).
Active selections appear as removable chips below the slicers. Select a chip’s × to remove a single filter, or select Clear slicers to reset all filters.
Summary vs. Detailed views
Use the Summary / Detailed toggle button group in the top-right corner to switch views:
- Summary: Displays the 7 headline KPI cards and all core analytical charts.
- Detailed: Includes all summary KPI cards and charts, plus the complete Class Performance table ranking all evaluated classes and aspects from lowest Digital Index score upward.
All KPIs, trend points, bubble charts, and tables update in unison to reflect the active slicer population.
KPI cards
The 7 KPI cards provide an immediate snapshot of the filtered population:
| KPI Card | Description |
|---|---|
| Digital Index | Element-weighted quality score percentage (0–100%). The subtext shows the delta compared to the previous ChangeSet (e.g. +2.4% vs previous). |
| Elements | Total count of element instances represented by the active filter. |
| Classes | Total number of evaluated geometric classes and aspects included in the selection. |
| Models | Total number of contributing design models. |
| Missing | Total count of missing required property values. |
| Invalid | Total count of invalid property values. |
| Properties | Count of evaluated required properties (or count of selected properties when the Property slicer is active). |
Analytical visualizations
1. Digital Index Trend
The Digital Index Trend line chart plots the filtered Digital Index percentage across all available ChangeSets (CS1, CS2, CS3, etc.).
- When slicers are applied, the exact same filter criteria are applied to all historical ChangeSets, allowing like-for-like regression analysis.
- If a class or model did not exist in an earlier ChangeSet, that point is gracefully omitted.
2. Class Risk Matrix
The Class Risk Matrix is a logarithmic bubble chart designed to prioritize remediation:
- Horizontal Axis (X): Digital Index score (0% to 100%). Classes further to the left have poorer data quality.
- Vertical Axis (Y): Number of element instances. Classes higher up have larger populations.
- Bubble Size: Logarithmically scaled based on population size, ensuring that high-volume classes stand out prominently while smaller classes remain visible and clickable.
- Hover Tooltip: Hovering over any bubble reveals the exact class name, Digital Index %, and total instance count.
[!TIP] Focus on the top-left quadrant: Bubbles positioned near the top-left represent classes with large element populations and low property completeness—these represent the highest risk to project information delivery.
3. Class and Model Performance
Two horizontal bar charts rank items from lowest score to highest:
- Class Performance: Ranks the lowest-scoring classes and aspects in the current selection.
- Model Performance: Ranks contributing model files by element-weighted Digital Index score.
4. Class × Model matrix
The Class × Model matrix provides a cross-tabulated heatmap grid of Digital Index scores for every populated Class/Model combination:
- Cells display the Digital Index percentage for that specific intersection.
- A dash (
—) indicates that the class does not exist in that model. - Interactive Drill-Down: Selecting any populated score cell automatically filters the dashboard to that exact class and model, instantly recalculating all KPI cards and charts for that intersection.
5. Property Completeness table
The Property Completeness table displays all configured properties, ordered from lowest coverage to highest:
- Property: Display name of the required property.
- Present: Number of elements containing a populated value for this property.
- Element Count: Total number of evaluated elements expected to have this property.
- Coverage: Percentage of elements meeting the requirement (
Present / Element Count * 100).
Use this table in conjunction with a class or model slicer to identify the exact missing fields that require authoring fixes in design tools.
Detailed Class table
In Detailed mode, the dashboard displays a full data table listing every evaluated class and aspect:
- Class Name: Full name of the geometric class or aspect.
- Elements: Total instance count.
- Properties: Number of required properties configured.
- Missing / Invalid: Exact error counts.
- Digital Index: Final quality score percentage.
Troubleshooting
| Symptom | Cause / Check |
|---|---|
| Report displays "Please select an iTwin, iModel, and Index Configuration" | Select the target iTwin, iModel, and Config in the page context. |
| Dashboard shows "No data is available for the current slicers" | The active combination of Class, Model, and Property slicers has no matching results in the published ChangeSet. Select Clear slicers. |
| Digital Index Trend chart only shows a single point | Only one ChangeSet has been published so far. Calculate and publish results across multiple ChangeSets to visualize historical trends. |
| Score cell in Class × Model matrix cannot be selected | Only populated score cells can be clicked for drill-down; cells showing a dash (—) have no instances. |