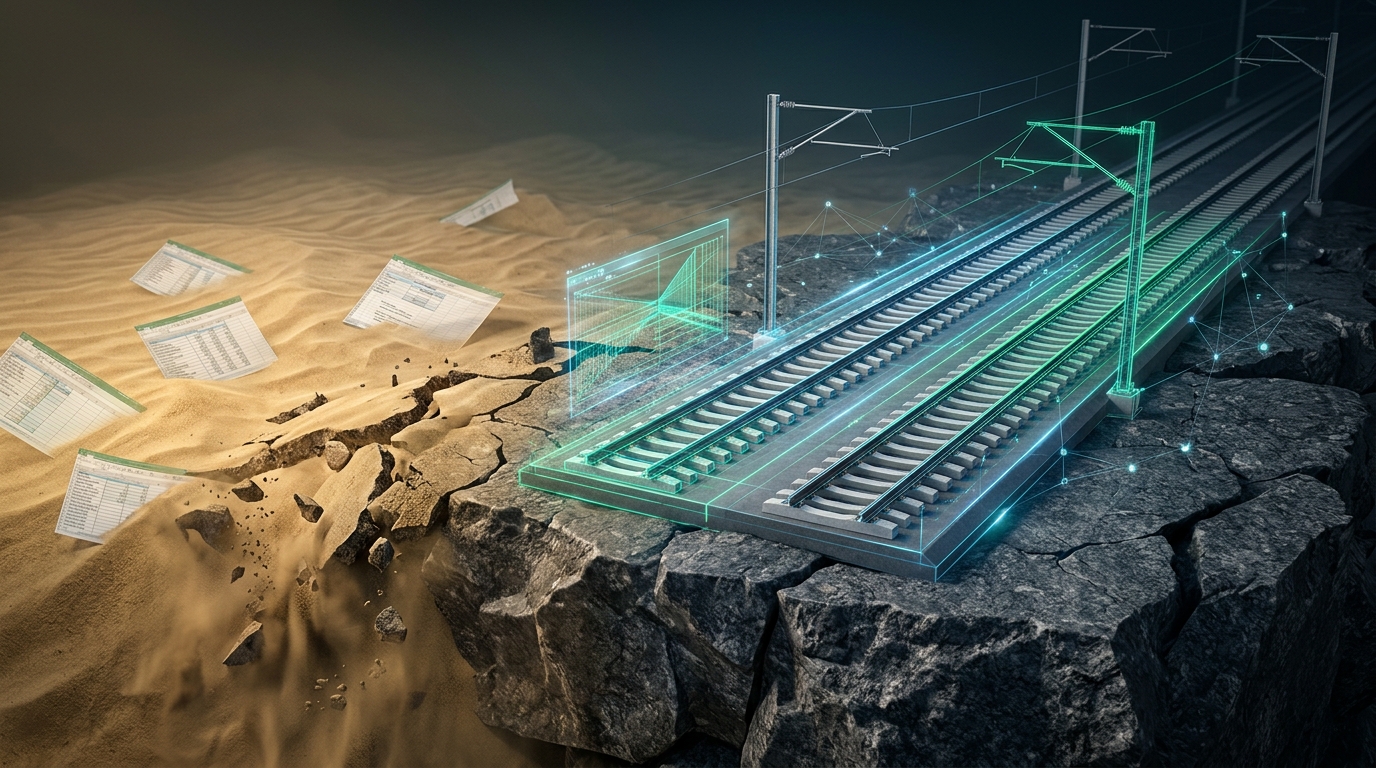
From Sand to Bedrock: What Happens When You Calculate Rail Carbon Directly from OpenBIM (IFC)?
Last week, I wrote about why UK infrastructure carbon is currently building on sand.
Between ICE v5 moving behind a paywall, fragmented EPD data, and the lack of standard asset schemas, we spend millions modelling millimetre-accurate engineering geometry, only to manually retype quantities into disconnected carbon spreadsheets.
Paul Rowlands rightly asked why tools like the RSSB Carbon Management Tool can’t just consume structured BIM data directly.
The standard answer is: "The schemas aren't standardised yet, the data is too messy, and it's too difficult."
We decided to test whether that's actually true.
We took an open IFC model of a rail corridor—the line between Dinsdale and Allens West - and built an automated, rule-based carbon calculation pipeline aligned directly to the RICS Whole Life Carbon Assessment (WLCA 2nd Edition) and PAS 2080 framework.
Here is what we learned—and what a practical OpenBIM carbon workflow looks like in practice.
1. The Geometry is Already There—The Schema is What Fails
When you look at a linear rail corridor in IFC (such as IFC 4.3), every rail, sleeper, ballast layer, overhead line mast, and track slab has precise volumetric geometry.
The breakdown does not happen in the CAD kernel. It happens at the boundary between engineering classification and carbon classification:
- The design model describes an asset as
IfcRailorIfcCivilElementwith custom supplier parameters. - The carbon tool expects a RICS Module A1–A5 elemental breakdown (Substructure, Superstructure, Trackbed, Electrification) matched to specific emission factors ($kgCO_2e/kg$ or $kgCO_2e/m^3$).
- Because no automated translation bridge exists, an engineer exports a schedule to Excel, manually guesses the material densities, looks up an ICE or EPD factor, and types it into a separate web calculator.
- Where there is automation into tools, there is generally an aggregation of data, which in itself is an abstraction that loses engineering granularity.
- Bentley's own carbon tool goes some way to working directly with the CAD data, but the requirement to manually map all elements into an aggregation reduces the benefits of automated carbon calculation.
The moment a human re-enters that data manually:
- Version control is destroyed.
- Changes in design geometry do not update the carbon assessment.
- Two engineers evaluating the exact same Dinsdale to Allens West track section end up with divergent embodied carbon totals.
- As the design progresses and more detail is added, the reality is that the carbon calculation increases but fundamentally increases the trust and quality of the result.
2. What an Automated RICS Carbon Workflow Looks Like
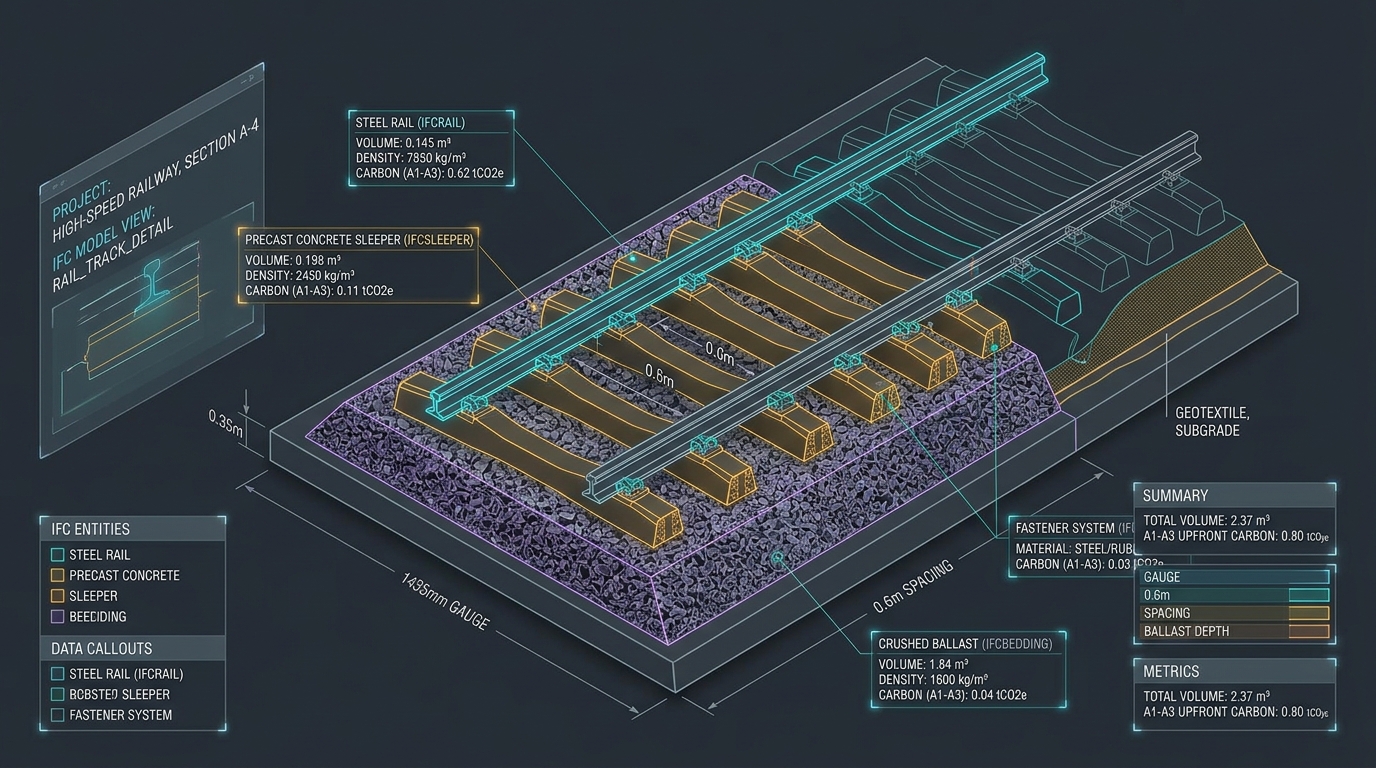
To move from sand to bedrock, you don't need a massive, monolithic platform. You need four connected capabilities:
- Direct Parameter & Volumetric Parsing: Extracting solid volumes, linear lengths, and component counts directly from the IFC entity attributes without relying on manual schedule exports.
- Dynamic Material & Density Profiling: Automatically assigning standardised material densities (e.g., standard rail steel at $7,850,kg/m^3$, precast concrete sleepers at $2,400,kg/m^3$, crushed granite ballast at $1,600,kg/m^3$) based on verified rule sets.
- Canonical Carbon Factor Matching: Linking each asset instance to authoritative, auditable emission baselines (BECD, ICE Database, or verified manufacturer EPDs) with full provenance tracking.
- Instant RICS Categorisation: Grouping every rail asset into RICS Whole Life Carbon elemental categories so project teams get an instant baseline for upfront carbon ($A1–A3$ production, $A4$ transport, $A5$ installation).
3. The Real-World Result: 5km of Track Assessed in Seconds
When we ran the Dinsdale to Allens West IFC model through our Digital Index Carbon Index:
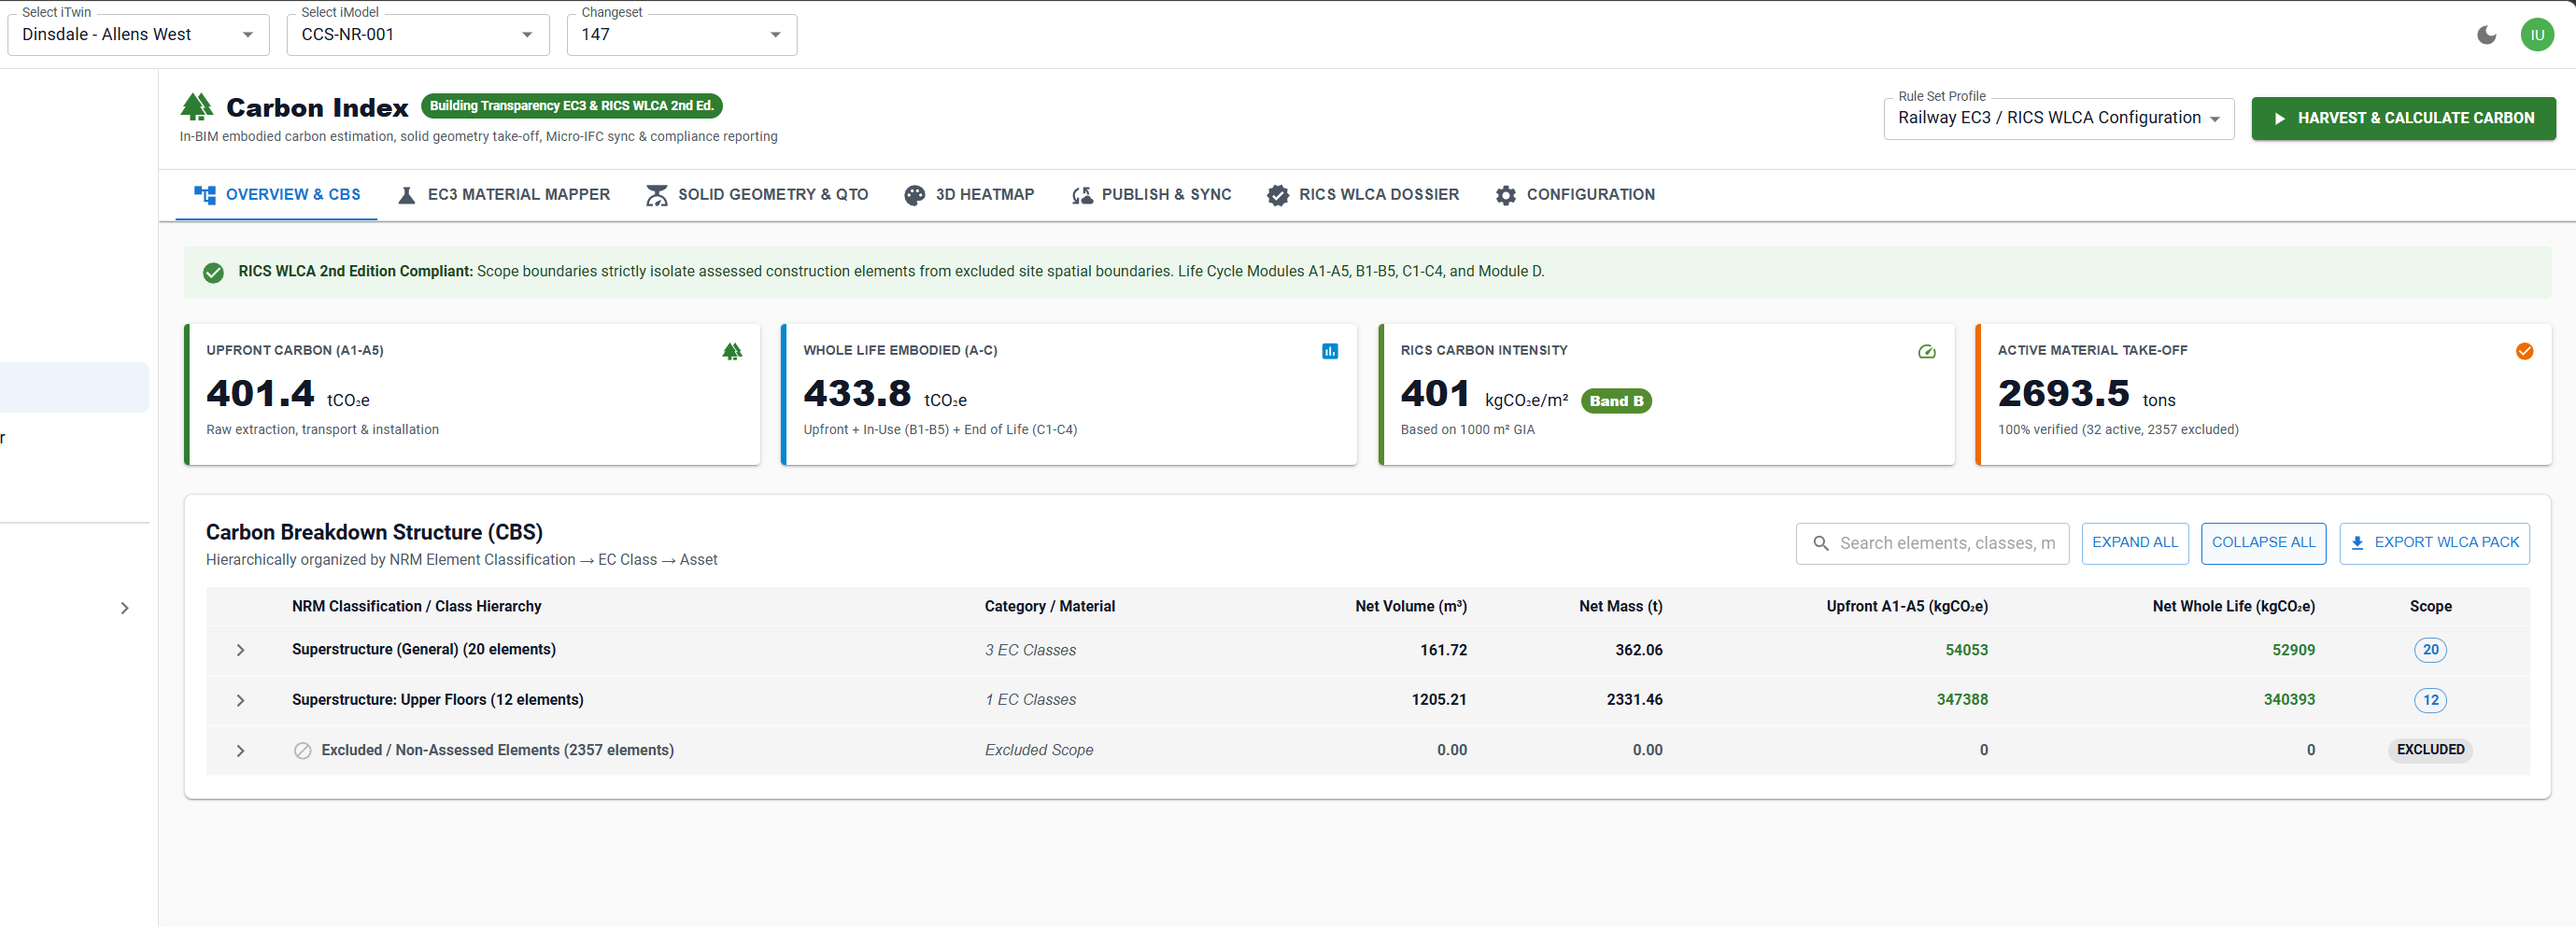
- Zero Manual Data Entry: We only worked on the two platforms, but we could have mapped every sleeper and rail.
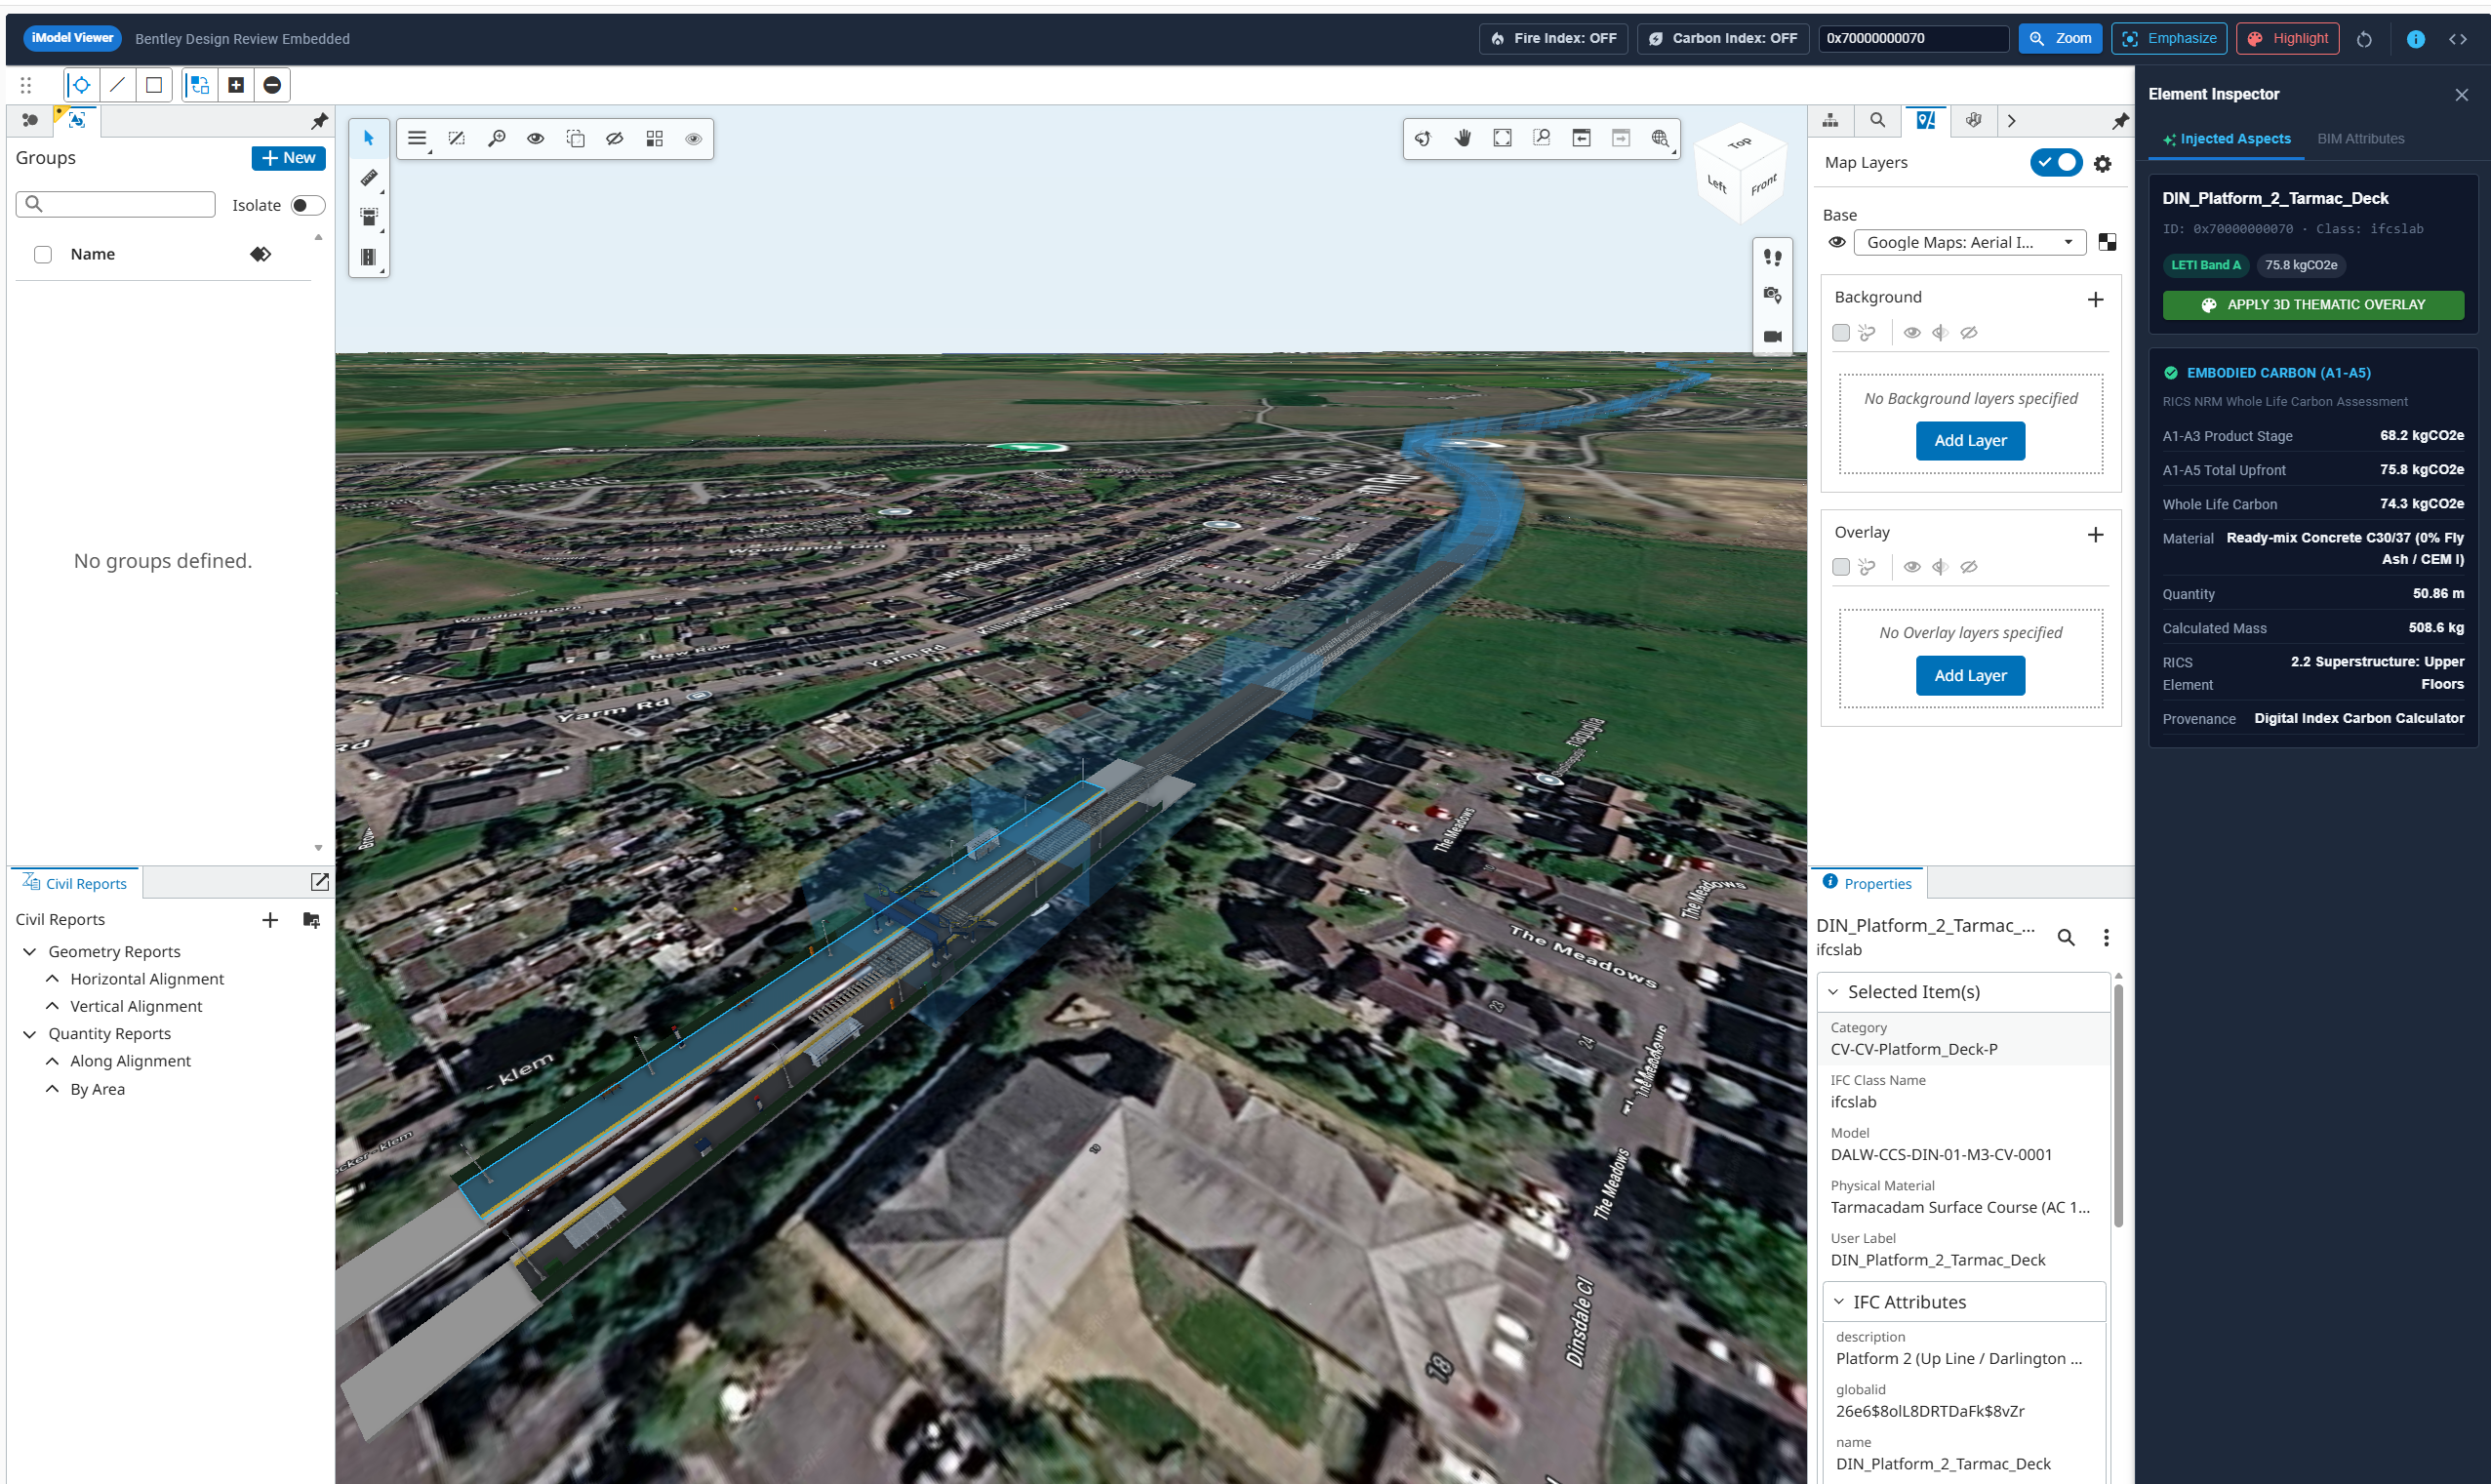
- Immediate Visibility of High-Carbon Hotspots: Rather than waiting weeks or at best days for a retrospective carbon report, the engineering team could visually inspect high-intensity elements directly on the asset federation.
- Auditability: Every single $tCO_2e$ figure traces directly back to a specific IFC GUID, a transparent quantity calculation, and a documented carbon factor.
Whenever design revisions are published—whether tweaking a rail profile or specifying low-carbon EAF steel—running a fresh harvest instantly recalculates the carbon footprint against the updated quantities
We have the ability to include this alongside the BIM Model using the iTwin Design Review, which allows us to view not only Carbon Index, but also FIREie Index values.
4. Establishing Common Ground for Infrastructure Carbon
Moving from sand to bedrock is ultimately about establishing a common, trusted ground for carbon calculations across our industry. If embodied carbon assessments are to carry the same engineering rigour as structural calculations or cost estimates, we must reach a point where:
- Consistency on the Same Project: Two engineers evaluating the same asset model arrive at the exact same carbon total.
- Comparability Across Projects: Engineers working on different schemes for similar rail assets produce comparable, auditable baselines based on shared rules.
- Transparent Auditability: Any reviewer or client can trace a calculation back to its source geometry, factor, and formula—giving real insight into the trust factor of the result. To make that standard practice across rail and infrastructure, we need three core foundations:
- Consistent Open Schemas: Standardised IFC property sets so engineering models flow directly into RICS and PAS 2080 classifications without loss of granularity or manual re-keying.
- Accessible, Provenance-Backed Factors: Shared, verified emission baselines so teams aren't forced to guess material densities or hunt across fragmented datasets.
- Rule-Based Automation: Repeatable, automated pipelines that eliminate manual spreadsheet error and let project teams rapidly optioneer lower-carbon designs. The capability to do this is operational today. By anchoring carbon calculations directly to open engineering data, we can move past subjective spreadsheet debates and build our decarbonisation decisions on solid ground.
What is your experience?
- How is your team currently bridging the gap between rail IFC/BIM models and carbon reporting?
- Are you still relying on manual spreadsheet extraction, or are you automating RICS/PAS 2080 workflows?
👇 Let’s discuss in the comments.
(If you are working on a rail or infrastructure iModel/IFC dataset and want to see how it scores against the RICS Carbon Index, message me or connect with C&C Solutions).
#EmbodiedCarbon #RailInfrastructure #IFCRail #OpenBIM #NetZero #RICS #PAS2080 #RSSB #DigitalTwin #DigitalIndex #BentleyiTwin #Decarbonisation