Digital-Index - Part 3
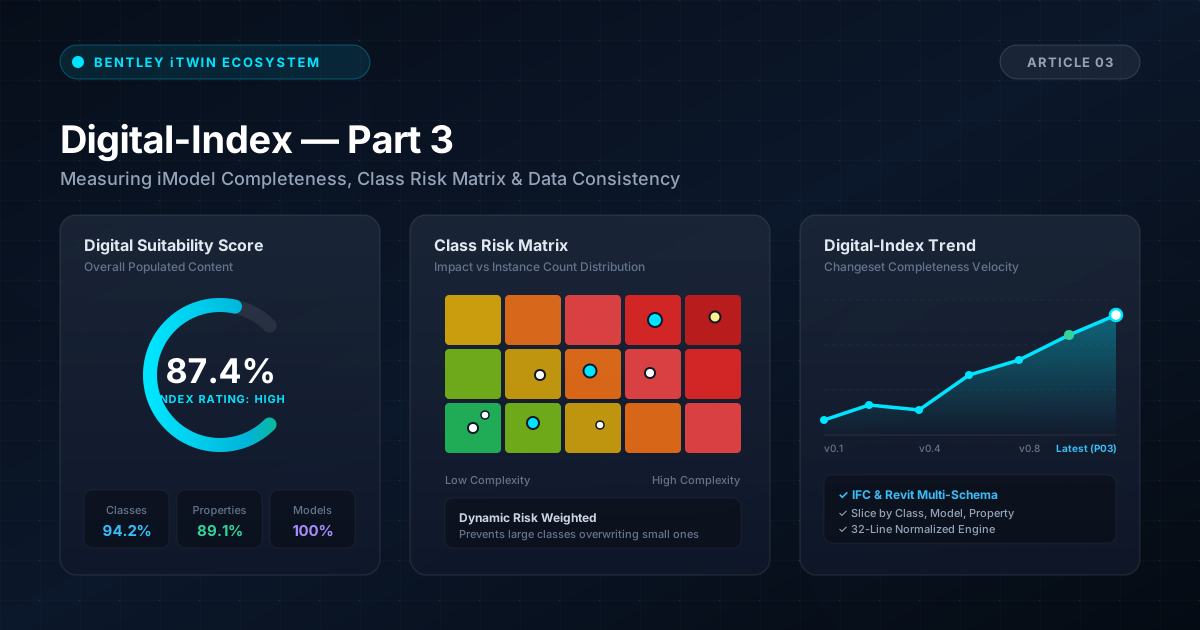
With the implementation of the Index tool, one of my targets was always to recreate the Suitability Index dashboard in a simple accessible way.
This week, I was diverted by my listing in Bentley's Ecosystem catalog, so thanks to Caroline and the rest of the Bentley Ecosystem team for their efforts in making this a very simple task for me.
However, after the flurry of the listing I returned to the task I had undertaken to recreate the Digital Index capability and started with the "Class Index" from my initial article, see my Observations Section underneath for some ideas on how to extend this.
Configuration
Basically I realised that we only care about the classes that are actually in the iModels. This can range from low 10's to 100's.
I worked on the principle that if we select a class we wanted all properties, but the configuration allows us to select the class and the properties and store these in a configuration which is available across the iTwin. It will be interesting as I expand this to more iModels how the mix match of schemas and classes is handled.
Also for sure the problem of the 1000's of classes in a Revit model needs to be addressed ... I am focussing on IFC for obvious reasons.
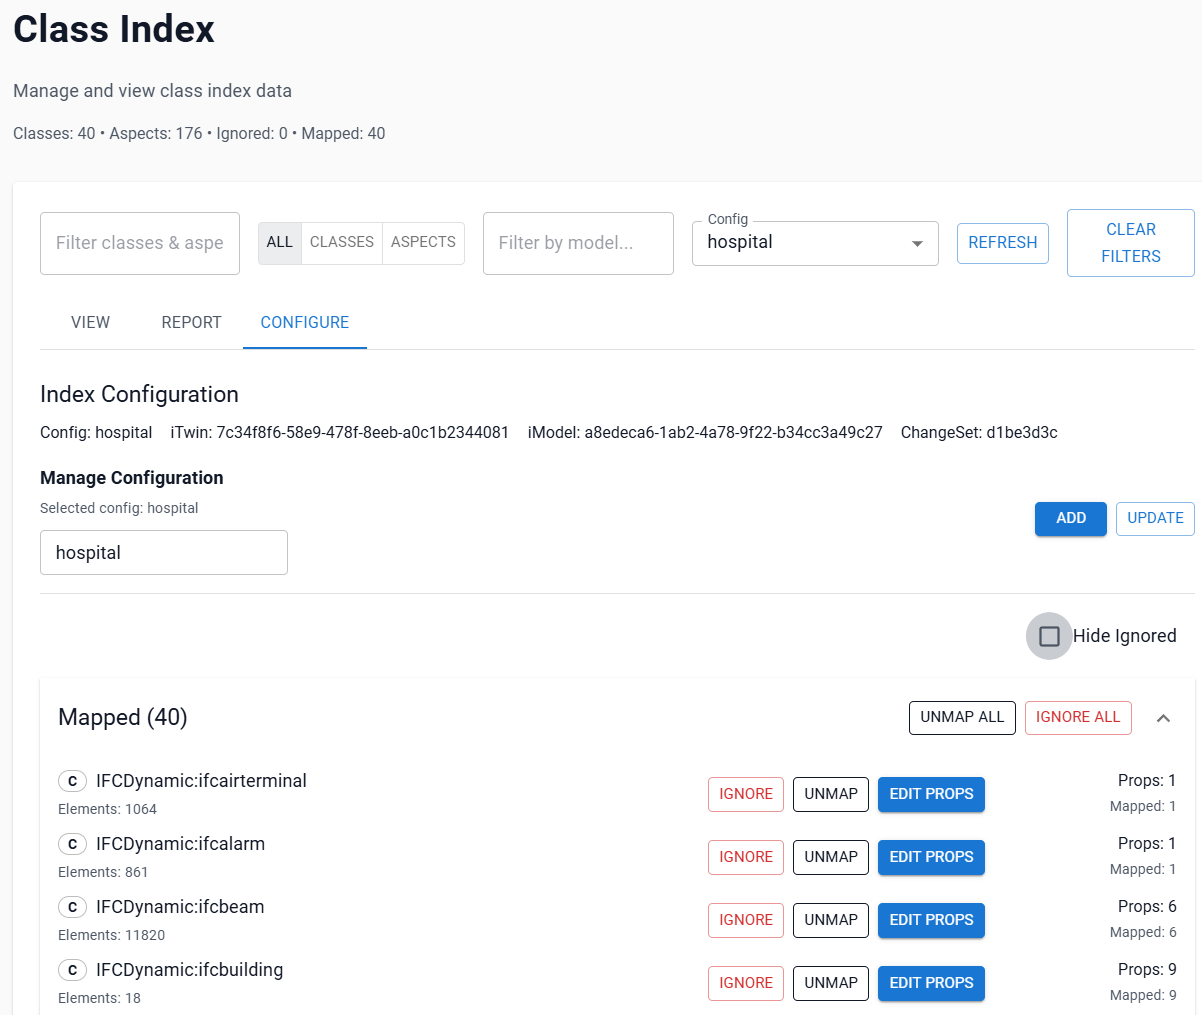
With the configuration done, I moved on to the calculation
Calculation
This is my Suitability Index, but in reality it is simply what is the populated content of a record ? I take into consideration the required properties and then calculate the Digital-Index for each row and roll that up to the class.
I started the process only considering the classes, but recent requests from the projects and others reminded me that we will probably find the problems are related to a single supplier or discipline. Therefore I quickly added in the capability to filter / calculate for the models in the iModel.
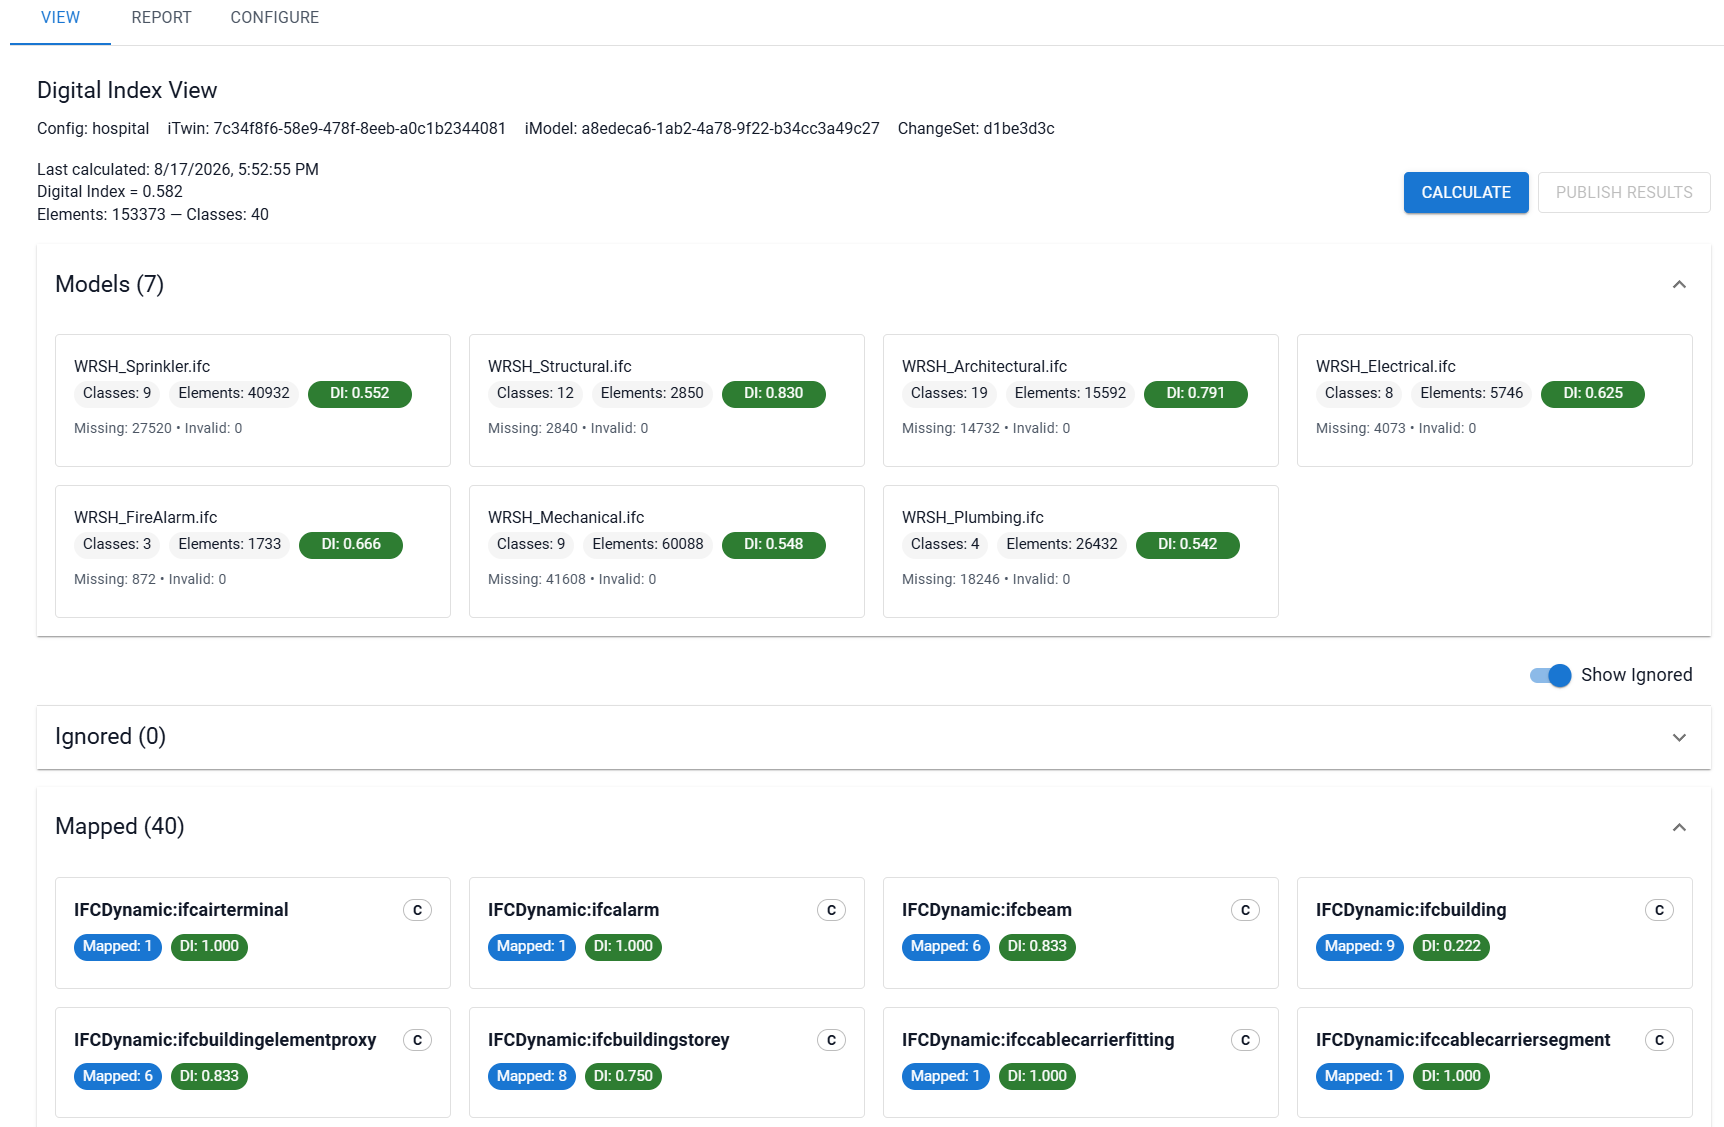
I have mainly tested with IFC models, I do have access to Revit models as well and some of the 1000's of models attached to DGN iModels would be interesting.
Report
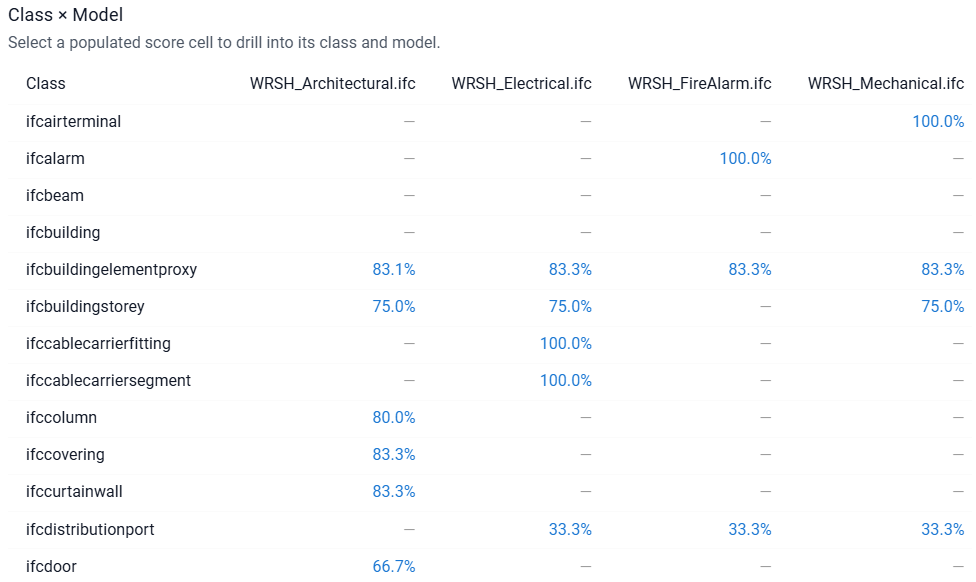
The Report section is where I am really hoping I can provide some insights. With the ability to slice by Class / Model / Property I can quickly drill into the areas that are hurting the Digital-Index score
Building out the facts for a single run of a Digital-Index was trivial with my AI Assistant, getting it down to 32 lines of code to normalise the information around classes and models makes the ability to slice the data much easier BUT a critical part of providing insights.
I think the most important will be the Digital-Index trend. How quickly is our data being completed, for the classes / properties we are interested in ?
I had to do some iterations around the Class Risk Matrix. Basically based upon the number of instances how does each class affect our overall Digital-Index. Is this helpful, The colours are to ensure larger classes do not overwrite the smaller classes.
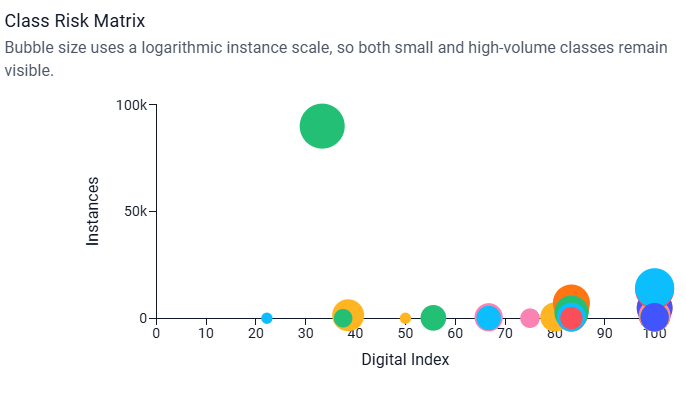 Class and Model information should be fairly straightforward.
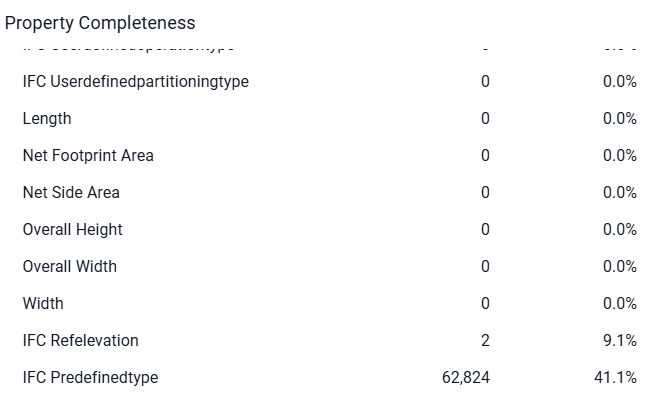
Property Completeness is perhaps something of interest especially for Revit users, but see my caveats at the bottom.
I have documented the features and capability here Digital Index
Observations
I was considering building out another "Index", but I think the configuration capability enables a user to consider the different types of Index.
- Construction Index would consider only the material / work-pack information
- Carbon Reporting would consider material and quantity properties for example.
Caveats
- Aspects For the structure of data I had to incorporate Aspects. This does make the configuration more complex, but unfortunately is a necessity for the iModels I am working with.
- Revit The Class Index feature works with Revit models and you can quickly add all classes, but I think I need some way to filter properties quickly. I do have some Revit models, but my focus currently is on IFC, but if someone would like to provide feedback on how the Revit portion could be improved, let me know.
- Trending I have not tested the ability to select previous changesets and build out a trend retrospectively so the results may look inverted unless you select your last changeset first.
What would you want to check or change on the reports section, how are you tracking trending ? Loading into PowerBI was a fairly standard process and @Colin Kerr wrote a very capable PowerBI Connector that I used to use. Once again let me know what you think I am always interested in how you are using your data, but just as importantly understanding how complete, correct and consistent is it ?